Flow Simulation 2017 Transient Explorer
How often do you solve transient problems in Flow Simulation? For a good portion of our users, nearly every computational fluid dynamics problem they solve is time dependent. Once the problem has solved, how do you review and visualize the transient results? Until recently there were only two options – review results for a single solved time step or export the transient data to the Animation Wizard. With the first option, the user would have to load results from a specific point in time and review the results. While this works, it takes time to load each time step but reviewing the results are not truly transient. Using the Animation Wizard improves the user’s ability to review time dependent plots, but there are limitations. Creating the animations is RAM intensive! If there is a significant amount of saved data to review and include, you either need lots of RAM installed or you must split the video into multiple segments.
For a few years now I and many of our Flow Simulation users have asked for an easier method of visualizing transient study results. With the release of SOLIDWORKS Flow Simulation 2017, that capability has arrived! The slick new feature called ‘Transient Explorer’ is the better method to visualize transient results that we have been waiting for. Let’s look at how to use the Transient Explorer with SOLIDWORKS Flow Simulation 2017.
After using the Flow Simulation Wizard to set up a transient study, you access the Calculation Control Options for Flow. On the Saving tab, there is a section for Selected Parameters (Transient Explorer). Click on the radio button on the Parameters line and choose what result quantities to save for the Transient Explorer. In my example, I chose to save the Pressure and Velocity data for my transient results post-processing.
After solving the CFD project, accessing the Transient Explorer widget can be accomplished via multiple methods. One option is to right-click on the Results icon from the Flow Simulation Feature Tree.
The other methods are to use the Flow Simulation Results pull-down arrow on the Flow Simulation Command Manager tab, or use the pull-down menus “Tools… Flow Simulation… Results… Transient Explorer”. Note that when you access this new tool, the data for the different results quantities you specified for all time steps is read into RAM on your workstation. Be patient while the data loads as it can take a minute or two, even longer if you have many saved time steps and lots of result quantities to load.
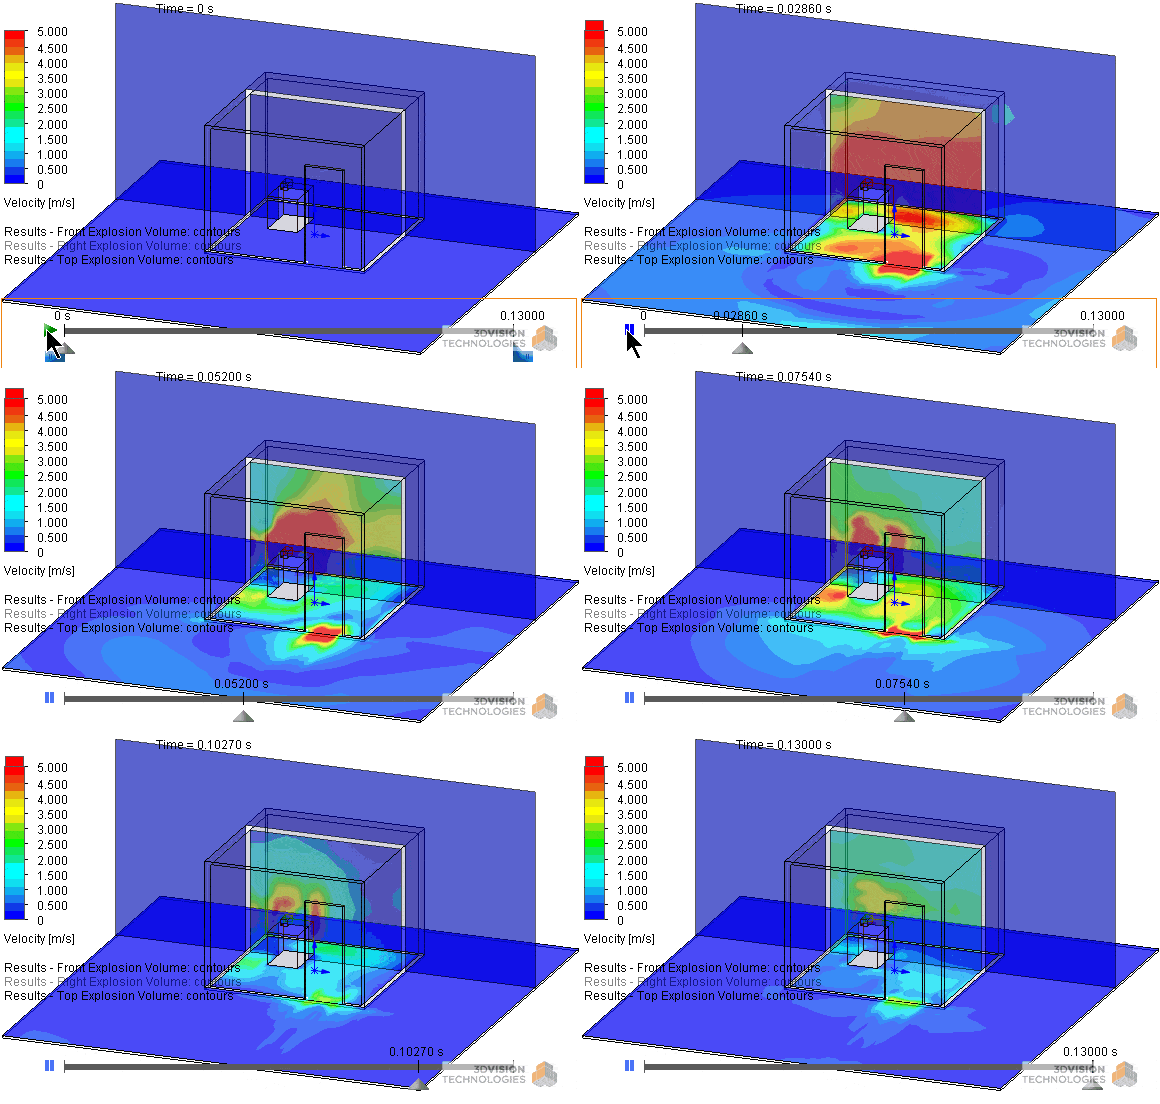
In the transient example I created, I’m simulating the first 0.13 seconds of an explosion. The CAD model includes a small volume with a specified high pressure as an Initial Condition. The Transient Explorer widget makes visualizing the pressure wave propagating through the computational domain a snap. The Transient Explorer widget will display results for Cut Plots, Surface Plots, XY Plots and Probes of the Flow Simulation Results. Accessing the Options for the Transient Explorer widget is accomplished by right-clicking on the timeline in the graphics window when the widget is active. Here I have two Cut Plots showing the Velocity results for my CFD example project.

The next time you need to solve a transient CFD project, be sure to check on the capabilities of the new Transient Explorer in Flow Simulation 2017. I think you’ll be impressed with this tool and how it improves visualizing transient results. Hopefully you can use this tool to impress your co-workers or wow everyone during your next design review! Now go make your products better with SOLIDWORKS Simulation!

 Blog
Blog 
