Using Excel as a Reporting Tool in SOLIDWORKS PDM
 Some SOLIDWORKS PDM administrators want to gain more use of their data. Installing and using Reporting in SQL Server can be very powerful, but it requires a foundation of knowledge in setting up reports, permissions, and additional installations that some companies are not willing to give a PDM administrator.
SOLIDWORKS PDM can also generate reports using the Report Generator, but it can only deliver the results in table format. Reporting in Excel can be more flexible and allow you to analyze the data with formulas and graphs without the need for installing and setting up the SQL Server Reporting Services. There are a few ways to import SQL data into Excel, but this is one way it can be done.
For this example, we will run a query to show what vault transitions are more frequently utilized. This example query is borrowed from SOLIDWORKS Solution S-070156.
First, you must create a data source file. To do this, navigate tot he Data ribbon and select From Other Sources > From Microsoft Query in the Get External Data section.
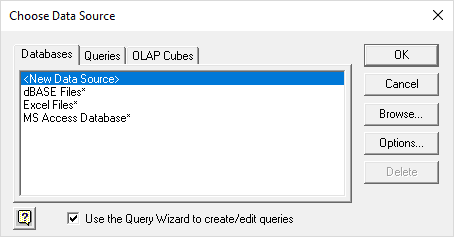
Select New Data Source and select OK to continue.
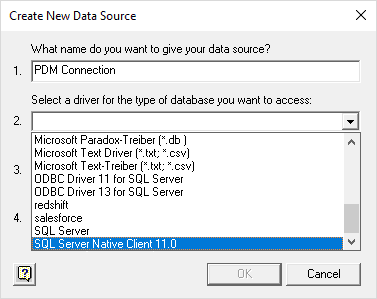
Next, select either SQL Server or SQL Server Native Client 11.0.
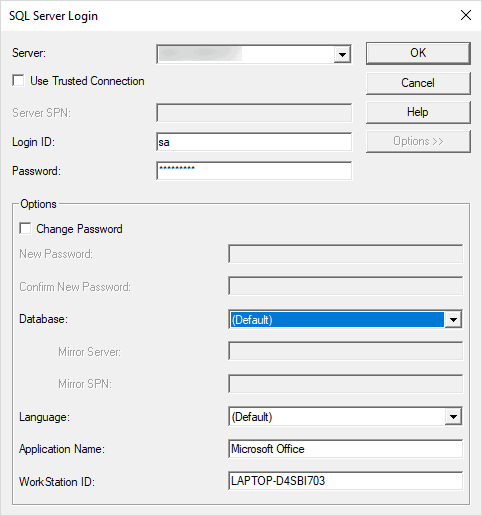
Enter the server name, login ID, and password. Select Options >> to choose your vault database. Once complete, select OK.
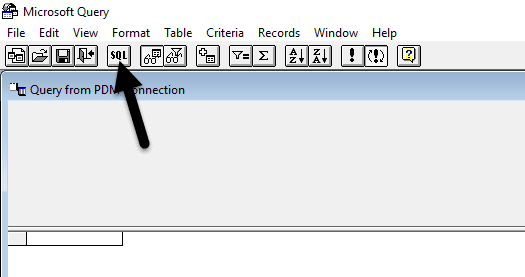
Select Cancel on the Query Wizard since it does not have enough power to create the query we need for this example. It will ask if you say Yes to the prompt asking if you want to continue editing in Microsoft Query. Select Close on the additional Add Tables pop-up that will come up. Click the SQL button in the top of the tool.
Enter the following query in the pop-up window:
select T.Name + ‘ (‘ + W.Name + ‘)’ as [Transition(Workflow Name)], Count(1) as [Count] from TransitionHistory TH
inner join Transitions T on TH.TransitionID = T.TransitionID
inner join workflows W on W.WorkflowID = T.WorkflowID
where W.WorkflowID > 1
group by W.Name, T.Name
order by 2 Desc
Select OK to submit the SQL statement. It will warn you that it can’t be represented graphically and will show the results of the query in a table. Select the Save button to save the file. This will be a reference for your Excel document so it must be kept with it. Finally, select Return Data to insert the data into Excel.

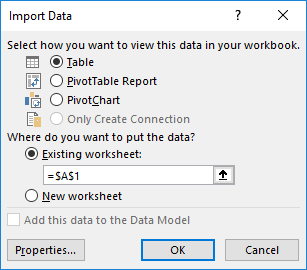
It will ask you what cell you would like to import the data at and if you would like it in Table, PivotTable Report, or Pivot Chart format. For this dataset, it makes sense just to use the Table format.
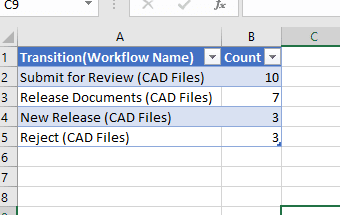
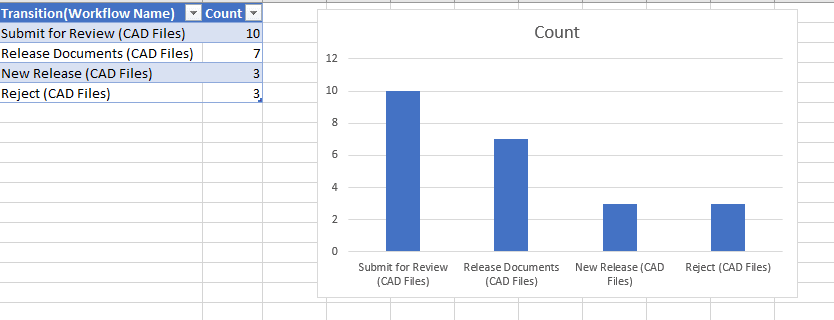
The result will be a table showing the most used states and how often they are used.
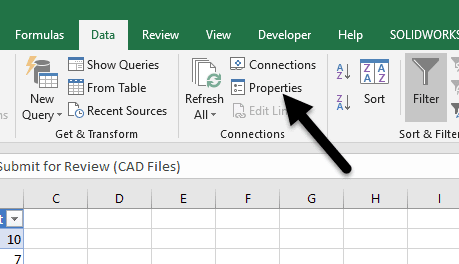
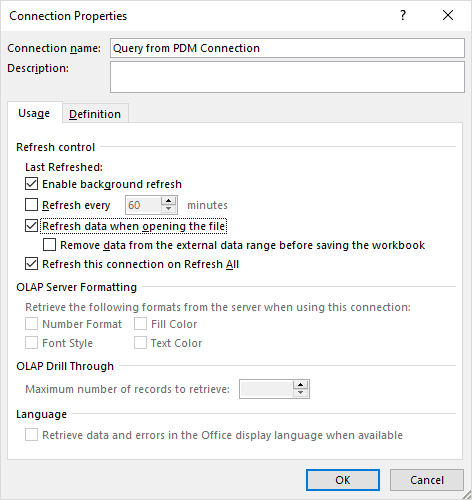
To ensure the data is refreshed every time the file is opened, click on a cell in the table and select Properties from the Connections section of the Data ribbon.
Then, select the Connection Properties button.
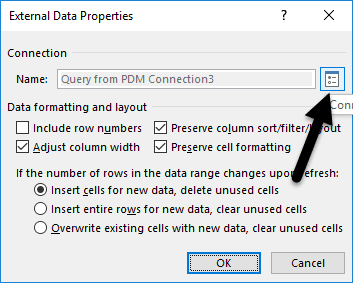
Finally, you can select the option to Refresh data when opening the file to make sure users are always viewing the most up-to-date information.
Now you can utilize your data in graphs, charts, and other calculations without needing access or knowledge about Reporting Services.
I hope you found this SOLIDWORKS PDM tip helpful. For more useful tips check out the related articles below.
Screenshots courtesy of Microsoft Office 2016.
Related Articles
Resetting the PDM Admin Password in SOLIDWORKS
SOLIDWORKS PDM Administrator 101: Topology & Latency
6 Questions (and Answers) for a Successful PDM Vault Implementation
About the Author
 Lindsay Early is an Application Engineer Consultant and has been with Fisher Unitech for seven years. Lindsay is a Certified SOLIDWORKS Expert and Elite Application Engineer having earned over 14 SOLIDWORKS Certifications including Mechanical Design, Simulation, and Data Mangement.

 Blog
Blog 